# devtools::install_github("JannisCodes/tsFeatureExtracR")
library(tsFeatureExtracR)

# just in case check that only variables that have any data (i.e., not all NA)
featData <- dtAll %>%
  arrange(ID, TIDnum) %>%
  select_if(~ sum(!is.na(.)) > 1) %>%
  as.data.frame

# Don't re-run unless you have a few hours to spare!
featFull <-
  featureExtractor(
    data = featData,
    pid = "ID",
    tid = "TIDnum",
    items = var_meta$name[var_meta$cluster == 1]
  )

# remove internal test account we missed earlier
featFull$features <- featFull$features %>%
    filter(
      ID != 19
)2. Feature Extraction
Armed with a relevant selection of key variables, the main aim of the feature extraction is to describe the most important and meaningful aspects of a time series. In its most general approach, feature extraction can include any numeric summary of the time series (Maharaj et al., 2019). Given this flexibility, a staggering variety of time series features have been proposed across different disciplines (Adya et al., 2001; Fulcher et al., 2013; Wang et al., 2006).
Feature Choice
With such a large number of options, choosing meaningful and relevant time series features is not an easy feat. However, not all time series features might be relevant to psychological time series or any particular research question. For example, a psychologist interested in well-being might not necessarily be interested in the exact time point after which 50% of the summed well-being values lie (i.e., relative mass quantile index) or how much different sine wave patterns within the well-being data correlate with one another (i.e., cross power spectral density). Instead, we advocate that we look at time series features that have a strong backing within the experience sampling (i.e., ESM) literature and offer meaningful interpretability.
Extraction Extraction
For our illustration, we rely on the work of researchers in the ESM literature, where different research teams have proposed a number meaningful measures to capture time series features that are relevant to psychological time series (Dejonckheere et al., 2019; Krone et al., 2018; Kuppens & Verduyn, 2017; Wendt et al., 2020). The main article discusses the individual time series features, their conceptual interpretation, as well as the technical calculation in more detail. Here we focus on the code to extract the features for the included variables.
The selection of time series features should always be driven by the research questions and field-specific conventions, but for our illustration we chose six time series features that relate to common psychological research questions and recent works within the field: (1) central tendency, (2) variability, (3) instability, (4) self-similarity, (5) linear trend, and (6) nonlinearity. We provide the featureExtractor() function to extract a number of measurements for each time series aspect. The function is also available as part of the R package that bundles a number of functions we used for the illustration.
The time series feature operationalizations we chose for our illustration here are marked in bold.
- central tendency
- mean
- median
- variation around the central tendency (i.e., variability)
- SD
- MAD
- (in)stability
- root mean square of successive differences (rmssd)
- mean absolute change (mac)
- self-similarity
- lag-1 autocorrelation
- periodicity (lag-2 & lag-14 autocorrelation)
- linear trend
- OLS regression parameter
- non-linear trend
- GAM edf
Note: Beyond the time series features described in this illustration, the tsfresh python package allows users to extract almost 800 time series features (Christ et al., 2018). The package is well maintained and offers clear documentation of how each time series feature is calculated.
We, thus, use enter our cleaned variables into the featureExtractor() function, where we additionally specify the participant id pid and the numeric time id tid as well as a vector with the column names of the variables for which we want to extract the features items.
Feature Missingness
After the feature extraction, again check how much missingess the data now entails. This check is important for two reasons. Firstly, the feature extraction should largely reduce the context-specific missingness as part of the summarization. However, secondly, even small numbers of missingness might not be accepted by some feature reduction or feature clustering algorithms. We this assess the missingess and impute the missing features based on the remaining data (provided that the missingness is small).
Check Missingness
To assess the missingness, we enter the extracted features into our feature_missing() function, which assess global and feature=specific missingess (including a graphical representation of frequency of different amounts of missingess across the extracted features).
feature_selection <- c(
  "ar01",
  "edf",
  "lin",
  "mac",
  "mad",
  "median"
)

perc_miss_features <-
  feature_missing(featFull$features %>%
                    select(ends_with(feature_selection)),
                  title = "Feature-wise Missingness")

perc_miss_features$plt_miss_per_feature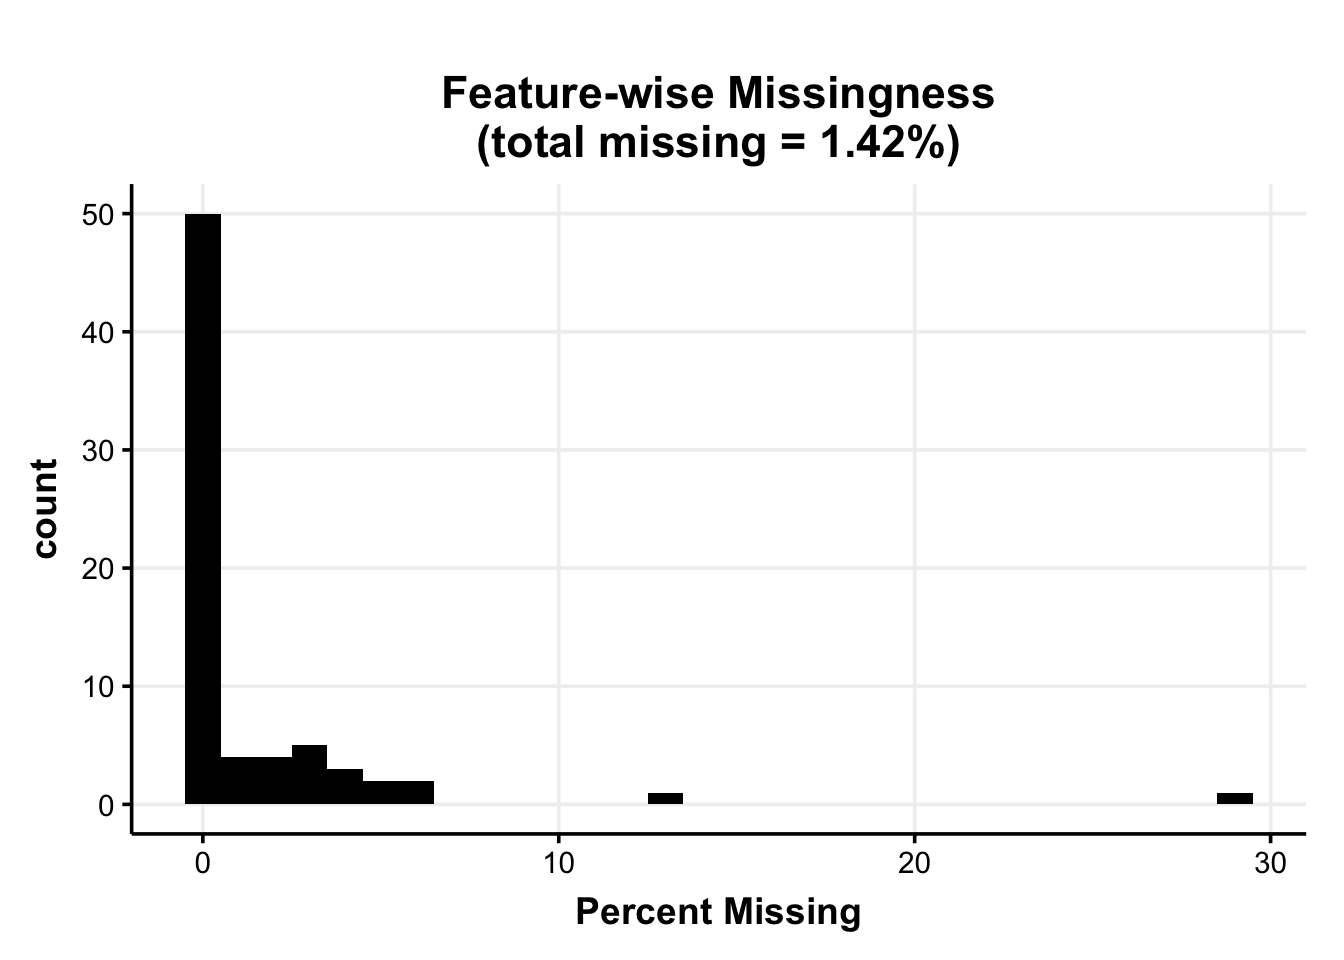
For the time series features across the three studies, we find that about 1.42% of the extracted features are missing across the 156 participants and 145 features. This might, for example, happen if participants do not have two subsequent measurements with outgroup interactions, so that an autocorrelation with lag-1 cannot be calculated for the contact-specific variables. The small number of missing values indicates that the feature-based approach indeed largely avoids the structural missingness issue.
Impute Missing Features
For all missing features, we impute a single predictive mean matching imputation using a custom wrapper (i.e., the featureImputer() function) of the MICE package (Buuren & Groothuis-Oudshoorn, 2011). Note again that with this procedure we only need to impute an extremely small number of missing values as most feature calculations can use the available data instead.
With the extracted and imputed features we will next have to check whether the feature set is still too large for a clustering analysis.
References
Adya, M., Collopy, F., Armstrong, J. S., & Kennedy, M. (2001). Automatic identification of time series features for rule-based forecasting. International Journal of Forecasting, 17(2), 143–157. https://doi.org/10.1016/S0169-2070(01)00079-6
Buuren, S. V., & Groothuis-Oudshoorn, K. (2011). Mice : Multivariate Imputation by Chained Equations in R. Journal of Statistical Software, 45(3). https://doi.org/10.18637/jss.v045.i03
Christ, M., Braun, N., Neuffer, J., & Kempa-Liehr, A. W. (2018). Time Series FeatuRe Extraction on basis of Scalable Hypothesis tests (tsfresh – A Python package). Neurocomputing, 307, 72–77. https://doi.org/10.1016/j.neucom.2018.03.067
Dejonckheere, E., Mestdagh, M., Houben, M., Rutten, I., Sels, L., Kuppens, P., & Tuerlinckx, F. (2019). Complex affect dynamics add limited information to the prediction of psychological well-being. Nature Human Behaviour, 3(5), 478–491. https://doi.org/10.1038/s41562-019-0555-0
Fulcher, B. D., Little, M. A., & Jones, N. S. (2013). Highly comparative time-series analysis: The empirical structure of time series and their methods. Journal of The Royal Society Interface, 10(83), 20130048. https://doi.org/10.1098/rsif.2013.0048
Krone, T., Albers, C. J., Kuppens, P., & Timmerman, M. E. (2018). A multivariate statistical model for emotion dynamics. Emotion, 18(5), 739–754. https://doi.org/10.1037/emo0000384
Kuppens, P., & Verduyn, P. (2017). Emotion dynamics. Current Opinion in Psychology, 17, 22–26. https://doi.org/10.1016/j.copsyc.2017.06.004
Maharaj, E. A., D’Urso, P., & Caiado, J. (2019). Time Series Clustering and Classification (1st ed.). Chapman; Hall/CRC. https://doi.org/10.1201/9780429058264
Wang, X., Smith, K., & Hyndman, R. (2006). Characteristic-Based Clustering for Time Series Data. Data Mining and Knowledge Discovery, 13(3), 335–364. https://doi.org/10.1007/s10618-005-0039-x
Wendt, L. P., Wright, A. G. C., Pilkonis, P. A., Woods, W. C., Denissen, J. J. A., Kühnel, A., & Zimmermann, J. (2020). Indicators of Affect Dynamics: Structure, Reliability, and Personality Correlates. European Journal of Personality, 34(6), 1060–1072. https://doi.org/10.1002/per.2277